Quickly see everything your application is doing, without modifying any of your code

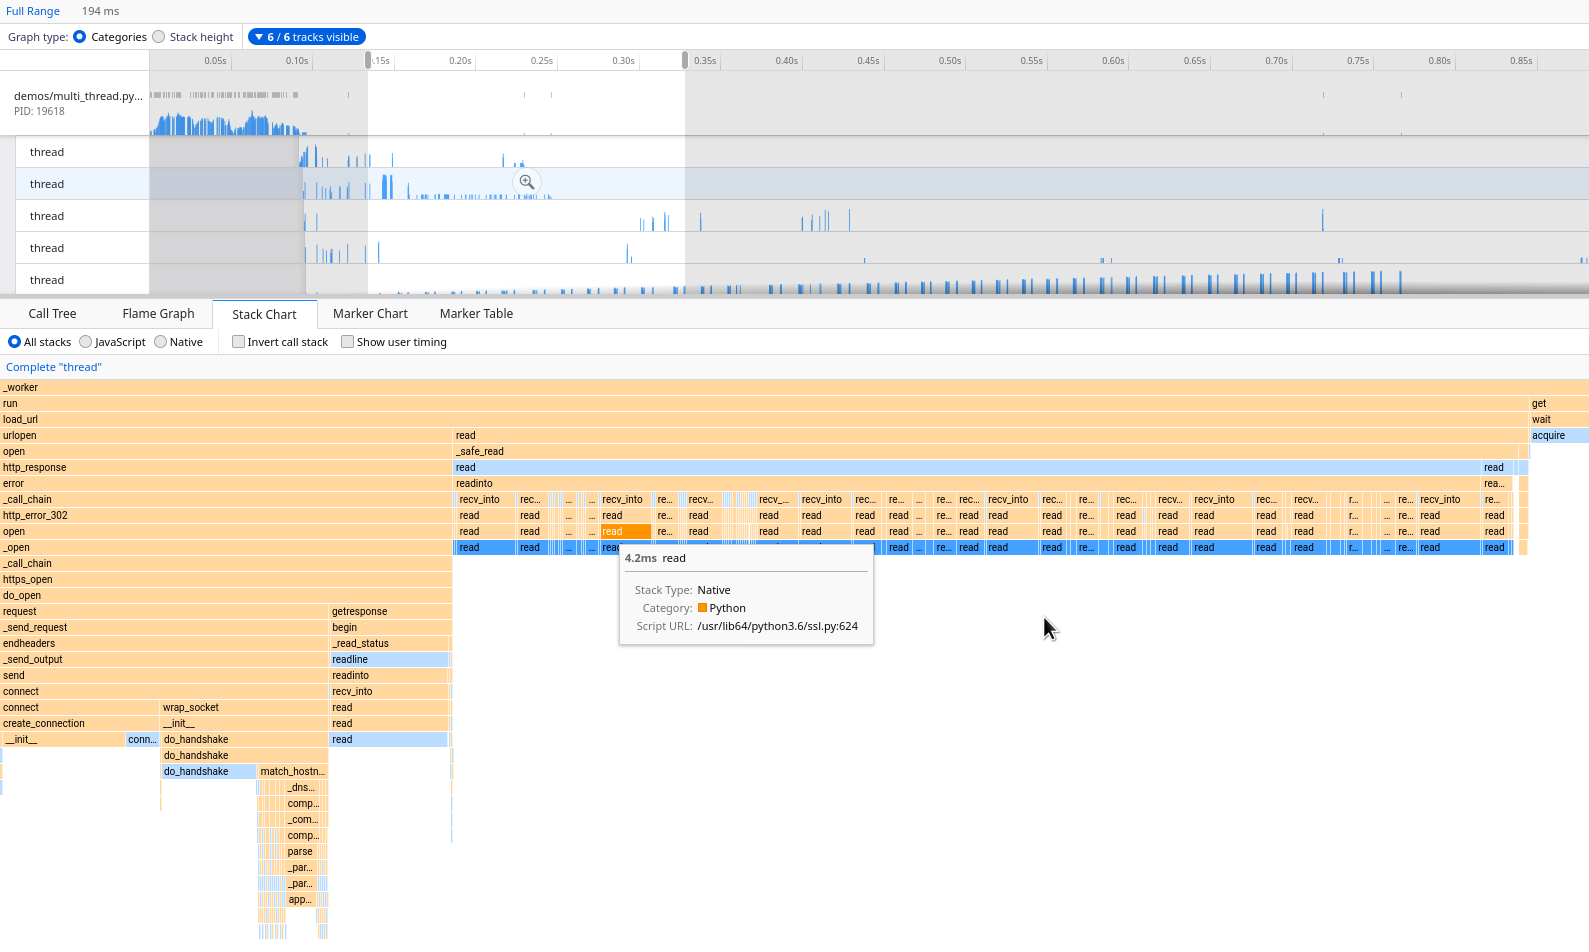
FunctionTrace can be called on existing Python applications with absolutely no modifications, and provides a complete and precise view of your application's entire execution. You'll see what functions your various Python processes and threads executed over time, when and what information was logged, where allocations occurred, and more.
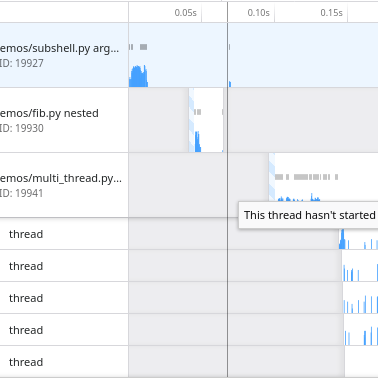
FunctionTrace supports all of the useful profiling views you're familiar with, including Stack Charts, Flame Graphs, and Call Trees, thanks to its integration with the Firefox Profiler.

Features

Shown profiling an application with three processes and six threads

Profile multithread and multiprocess applications with ease

See precise profiling information throughout your entire application, rather than being limited to just one process or thread.

Shown profiling memory with a flame graph of allocations

Trace memory allocations throughout your application

FunctionTrace can track allocations throughout function calls in your application, telling you where to focus your optimization efforts.

Shown profiling function calls taking fractions of a millisecond

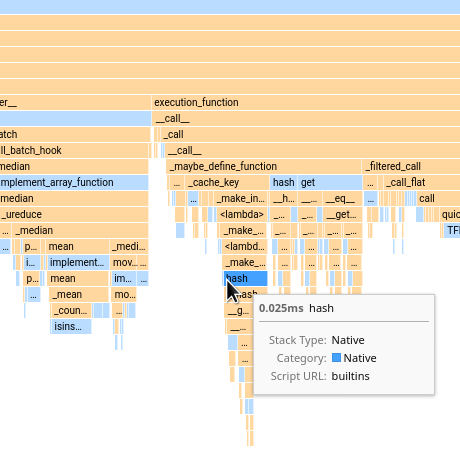
Profiling is non-sampled and low-overhead

You'll never miss small but interesting function calls when looking at a FunctionTrace profile, as all information is recorded. You also don't need to pay for this - profiling overhead is <10%, even on complex applications.
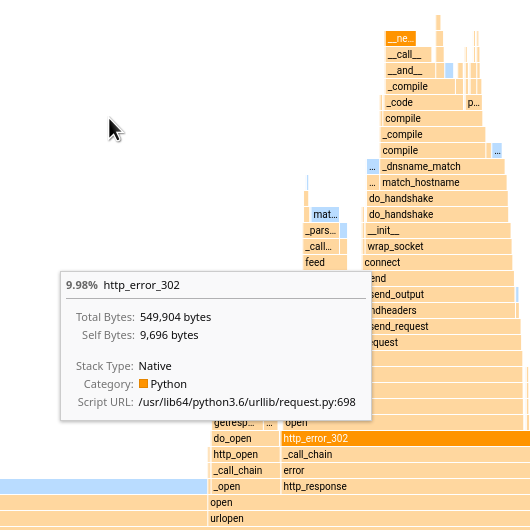
Profiles can easily be uploaded and shared

When a developer encounters a bug or performance issue, they can easily send the recorded FunctionTrace profile to their team, allowing multiple people to investigate the issue without needing to reproduce it.

Installation and Use

Installing FunctionTrace (Nix)

If you use Nix, you can easily try a recent version of FunctionTrace with nix-shell -p functiontrace, or install it via pkgs.functiontrace.

Installing FunctionTrace (Linux/Mac)

FunctionTrace comes in two necessary pieces: a server, and a language-specific client.
Note: It's currently necessary to have cargo installed in order to install FunctionTrace, as functiontrace-server is not packaged for all supported operating systems. You can install cargo via rustup.

# Install the server
$ cargo install functiontrace-server

# Install the Python client
$ pip install functiontrace

Installing FunctionTrace (Windows)

FunctionTrace is not currently supported on Windows. Pull requests to add support are welcome.

Tracing Your Application

To trace a Python application Foo.py, load it via functiontrace:

$ functiontrace Foo.py arguments_for_foo

Alternatively, you can modify your code to start tracing at some point during its runtime:

import functiontrace
functiontrace.trace()
By default, FunctionTrace will emit a trace file (in the form of functiontrace.time.json) to the current directory, though the location can be controlled via the --output-dir switch when running functiontrace.

Viewing Traces

To view a recorded trace file, go to the Firefox Profiler and choose Load a profile from file, then select the desired trace file. This step will perform some processing, but is entirely local - your trace file never leaves your own machine!
Note: If this is your first time using the Firefox Profiler, you may want to skim the UI guide for it.

You'll likely want to start with the Stack Chart view to get an overview of your application's execution, then use the Flame Graph view if you want to dive into optimization opportunities.

Traces can also be loaded directly from the internet, which can be particularly useful when examining services on remote servers or sharing traces with others. For an example, you can play with this Live Demo.